Observability
The manager collects metrics through Micrometer and routes them to exactly one sink per process. The sink is selected by quack-on-demand.metrics.sink (QOD_METRICS_SINK), one of prometheus, aws, azure, gcp, or none. For the full list of emitted series and their labels, see the Metrics reference.
Prometheus pull (the default)
With sink = prometheus (the default) the manager exposes an unauthenticated scrape endpoint, same policy as /health:
GET http://<host>:20900/metrics
A minimal scrape config:
scrape_configs:
  - job_name: quack-on-demand
    static_configs:
      - targets: ['quack-manager.svc:20900']
    metrics_path: /metrics
Local stack via the observability profile
The compose stack bundles Prometheus and Grafana behind the observability profile. Bring up the manager, Postgres, Prometheus, and Grafana in one command, with demo data seeded so the dashboard has live data:
LOAD_TPC=1 PROFILES=observability ./scripts/run-docker-compose.sh

# Clean slate
NUKE=1 LOAD_TPC=1 PROFILES=observability ./scripts/run-docker-compose.sh
Prometheus scrapes the manager container directly over the compose network. Grafana is preprovisioned with the Prometheus datasource and the bundled dashboard, so it renders without manual setup. The boot output prints the URLs:
Manager UI:    http://localhost:20900/ui/       (admin / admin)
Prometheus:    http://localhost:9090            (try query: up)
Grafana:       http://localhost:3000            (anonymous admin; no login)
               Dashboard: "Quack-on-Demand - Operator Overview"
Grafana runs anonymous-admin for zero-login local use; do not expose port 3000 to a public network without disabling that. See the Docker deployment page for the profile mechanics. Tear down with docker compose -f docker-compose.yml --profile observability down.
Standalone Prometheus + Grafana
When the manager runs outside compose (for example in Kubernetes, reached by kubectl port-forward), bring up only the observability containers from the observability/ directory, which scrape the manager via host.docker.internal:20900:
kubectl -n qod port-forward svc/qod-quack-on-demand 20900:20900 &
docker compose -f observability/docker-compose.yml up -d
The preprovisioning (datasource UID, auto-loaded dashboard) is identical to the integrated path.
Cloud push (aws / azure / gcp)
When a cloud sink is selected the manager pushes metrics on a fixed cadence (default 60s) via the cloud SDK, and the /metrics Prometheus endpoint is not exposed.
| Sink | Select with | Required config | Credentials |
|---|---|---|---|
aws | QOD_METRICS_SINK=aws | QOD_METRICS_AWS_NAMESPACE (default quack-on-demand) | DefaultCredentialsProvider chain (IAM role, env, profile) |
azure | QOD_METRICS_SINK=azure | QOD_METRICS_AZURE_KEY (Application Insights key, required) | DefaultAzureCredential (managed identity, env, CLI) |
gcp | QOD_METRICS_SINK=gcp | QOD_METRICS_GCP_PROJECT_ID (required) | ADC (GOOGLE_APPLICATION_CREDENTIALS, GCE metadata, gcloud) |
Override the cadence with QOD_METRICS_AWS_STEP_SEC / QOD_METRICS_AZURE_STEP_SEC / QOD_METRICS_GCP_STEP_SEC.
Only one sink runs per process. There are no per-backend enable flags; the single sink field is the sole selector. Selecting a cloud sink means /metrics is unavailable and no other sink is active.
Audit journal health
The event journal that feeds the audit subsystem exposes one counter:
| Metric | Labels | Meaning |
|---|---|---|
qod_journal_dropped_total | table | Number of events dropped because the bounded journal queue was full, or because an append to the store failed |
A non-zero value means the affected telemetry table undercounts by that amount. The table label identifies which table was affected: table="audit" means missed audit events; table="stmt_history" means missed statement rows, which in turn causes undercounted hourly rollup buckets and gaps in the History charts. Under sustained overload the data-plane audit trail degrades before the data path does, by design: offer is non-blocking and the hot path never waits on Postgres.
When this counter climbs, check Postgres write latency and the journal queue depth. If the rate is low and intermittent it indicates short Postgres blips; if it is sustained, consider scaling Postgres or reducing data-plane statement throughput. The journal queue depth is configured by QOD_TELEMETRY_JOURNAL_CAPACITY (default 8192): the bounded in-process telemetry journal capacity; overflow drops events and increments qod_journal_dropped_total. Increase this value to buffer higher data-plane statement throughput under temporary Postgres write latency spikes; this trades memory for durability.
The counter stays at zero when QOD_TELEMETRY_STORE=none because not recording is intentional, not a drop.
Metrics vs. the usage ledger
statements_total and statement_duration_seconds (both tagged tenant, pool, status) are the real-time, in-process view of statement activity: they increment on every completed statement and are exported at the Prometheus scrape interval or cloud-push cadence. They answer questions like "what is the current QPS per tenant?" but do not persist across process restarts.
The Usage page and GET /api/usage are the durable ledger view of the same quantities. They are backed by the daily rollup store in Postgres, retained for QOD_USAGE_RETENTION_DAYS (default 400 days), and are the right integration surface for monthly billing exports and capacity planning over longer windows. The qod_journal_dropped_total{table="stmt_history"} counter bridges the two views: a non-zero value means the usage ledger undercounts by that amount for the affected period.
Common labels
Attach static labels to every series to distinguish environments in a shared Grafana:
| Variable | HOCON key | Purpose |
|---|---|---|
QOD_METRICS_DEPLOYMENT | metrics.commonTags.deployment | Deployment name, e.g. prod-eu |
QOD_METRICS_REGION | metrics.commonTags.region | Cloud region, e.g. eu-west-1 |
Disabling metrics
Set QOD_METRICS_SINK=none: no /metrics endpoint is mounted, no cloud push occurs, and all counters, timers, and gauges become no-ops.
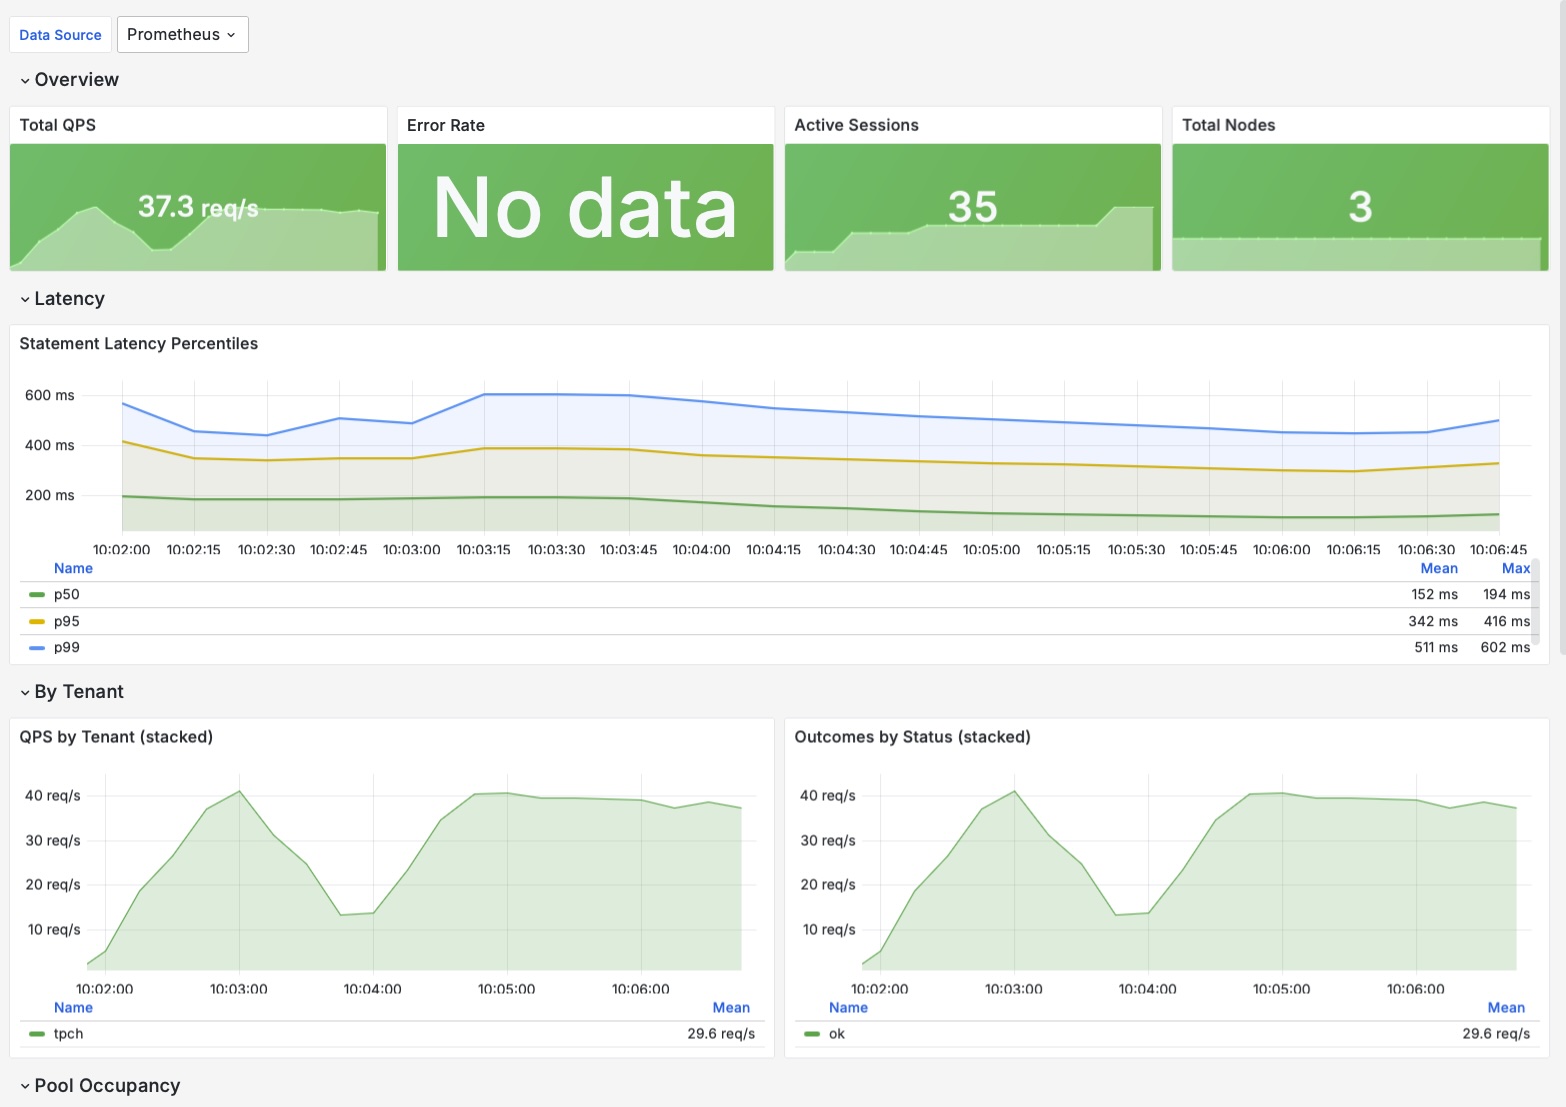
The bundled Grafana dashboard
observability/grafana-dashboard.json is a single-screen operator overview, ready to import (Grafana 10.x: Dashboards → New → Import → Upload JSON file, then pick your Prometheus datasource; the ${datasource} variable resolves to its UID).
| Row | Panels |
|---|---|
| Overview | Total QPS, error rate, active sessions, total nodes |
| Latency | p50 / p95 / p99 statement-duration percentiles |
| By Tenant | Stacked QPS per tenant, outcomes by status |
| Pool Occupancy | Node count by tenant / pool / role |
| Node Health | Per-node table: healthy, draining, in-flight, EWMA latency |
| JVM | Heap used, GC pause rate, live threads, process uptime |
The metric names and labels these panels query are listed in the Metrics reference. For the QOD_METRICS_* configuration keys, see the Configuration reference.