Run the platform
The Nodes board is the at-a-glance operational view for a running deployment. From it you can spot trouble, scale compute up or down, drain a pool before maintenance, and drill into recent statements. This page walks through each of those tasks as step-by-step playbooks with the equivalent qod CLI command for scripting and automation.
Watch the Nodes board
Goal: Confirm the fleet is healthy and identify hot pools, draining nodes, or idle nodes at a glance.
Prerequisites: Signed in as a superuser or tenant admin. At least one pool is running.
Steps (UI):
- Click Nodes in the top navigation bar. The board loads automatically on sign-in.
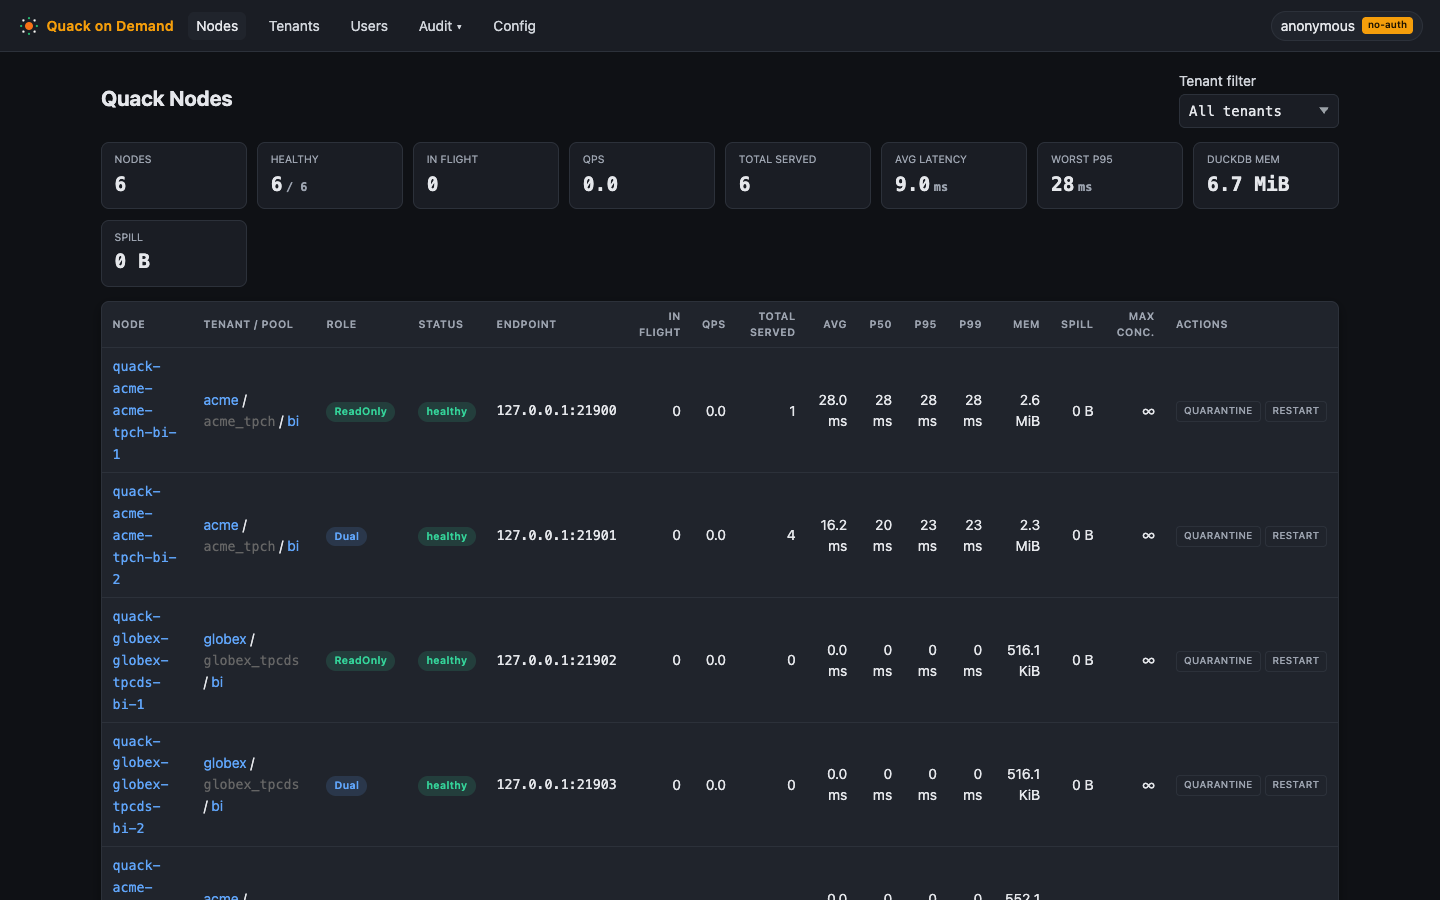
- The table lists every Quack node across all tenants, grouped by tenant and pool. Each row shows:
- In-flight - statements currently executing on that node.
- Total served - lifetime count since the manager last started.
- Avg latency - exponentially weighted moving average in milliseconds.
- Role -
ReadOnly,WriteOnly, orDual. - Healthy / draining flags.
- To spot a hot pool: look for nodes with a consistently high in-flight count or rising average latency. Use Scale a pool to add nodes.
- To spot a draining node: the row shows
draining: true. It is excluded from new routing picks and will disappear once its stop completes. - To spot an idle node: in-flight is 0 and total served is low relative to siblings. If the entire pool is idle you may want to scale it down to save resources.
CLI equivalent:
# Live node table (used by the UI)
qod --json pool list | jq -r '.pools[].nodes[] |
  "\(.nodeId) role=\(.role) healthy=\(.healthy) served=\(.totalServed) p50=\(.p50Ms) p95=\(.p95Ms) p99=\(.p99Ms)"'
Per-node fields surfaced via qod --json pool list:
inFlight- currently executing statementstotalServed- lifetime counter since manager startavgDurationMs- EWMA latencyp50Ms/p95Ms/p99Ms- rolling 256-sample windowhealthy/draining- tracker flags
Verify: Run a query through the FlightSQL edge and reload the Nodes board. The in-flight counter briefly increments during execution, and total-served increments by one after it completes.
Related: Observability, Metrics reference.
Scale a pool
Goal: Increase or decrease the node count of a pool without deleting and recreating it.
Prerequisites: Signed in as a superuser or tenant admin. The target pool exists and has at least one running node.
Steps (UI):
- Click Tenants in the top navigation bar and select the target tenant.
- On the Pools tab, click the pool name to open its detail page.
- Click Scale.
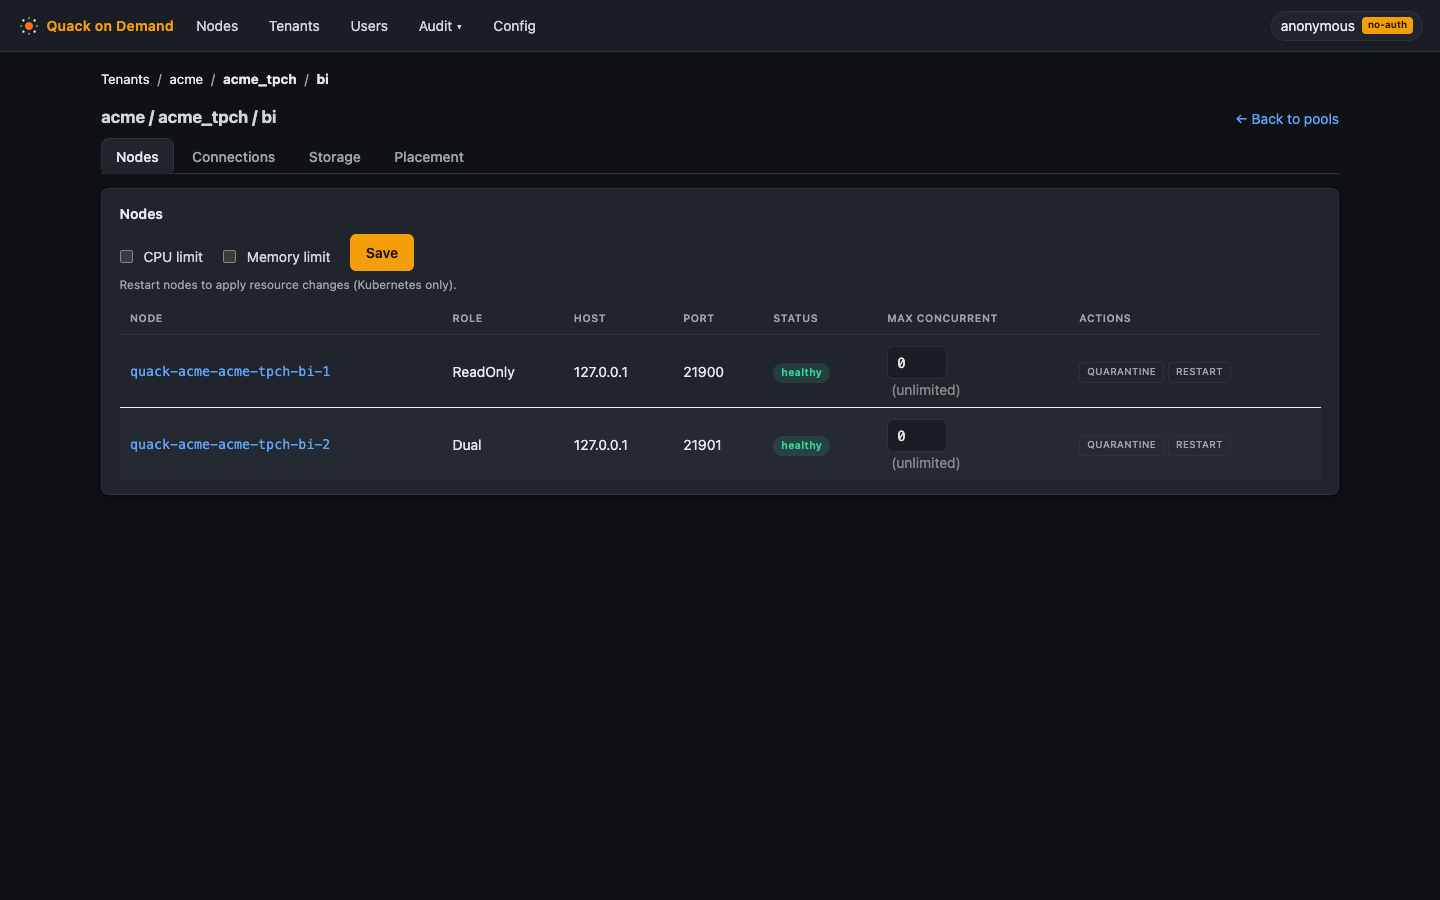
- Set the new Target size (total node count) and adjust the Role distribution sliders (WriteOnly, ReadOnly, Dual). The distribution must sum to the target size.
- Click Apply. The manager computes the diff: surplus nodes are stopped, and deficit nodes are spawned.
Manifest (YAML)
Re-importing the manifest upserts the pool to this distribution, which is the scale operation.
tenants:
  - name: acme
    pools:
      - name: bi
        tenantDb: acme_tpch
        roleDistribution: { writeonly: 1, readonly: 2, dual: 3 }
CLI equivalent:
# Scale up
qod pool scale --tenant acme --db acme_tpch --pool bi --target-size 6 \
  --writeonly 1 --readonly 2 --dual 3
Verify: Return to the Nodes board. The new node count appears as rows grouped under the pool. Newly spawned nodes may show healthy: false for up to 5 seconds while the health probe runs its first check.
Related: Pools and cohorts.
Drain vs force-stop
Goal: Bring a pool to zero nodes either gracefully (drain) or immediately (force), without deleting the pool registration.
Prerequisites: Signed in as a superuser or tenant admin. The target pool is running.
Steps (UI):
- Click Tenants, select the tenant, and open the Pools tab.
- Two stop actions appear per pool:
- Drain - graceful stop. Each node is marked as draining in the router so no new statements are routed to it, then the node process is stopped. Use this during planned maintenance when you want to stop routing new queries to the pool before it shuts down. Drain does not wait for in-flight queries to finish, so statements already executing on a node can still be interrupted.
- Force - immediate stop. Nodes are stopped without a draining period. Any statements in flight on those nodes are failed and returned to the client as errors. Use this when a pool is wedged and drain is not making progress.
- After either action the pool row stays in the registry with zero nodes and a zero distribution. It is not deleted. Reconcile will not respawn nodes because the persisted distribution is zero.
- To bring the pool back: use Scale and set a non-zero target size.
CLI equivalent:
# Stop a pool: scales it down to 0 nodes but KEEPS the pool (--force skips graceful drain)
qod pool stop --tenant acme --db acme_tpch --pool bi --force
Omit --force to drain instead of force-stopping.
Verify: On the Nodes board, the pool's rows disappear. The pool itself still appears in the Tenants -> Pools tab with zero nodes, confirming it is registered but stopped.
Related: Resilience and recovery (graceful drain detail, reconcile behavior), Pools and cohorts.
Read statement history
Goal: Inspect recent SQL statements routed through the fleet, newest first, to audit activity or diagnose a slow query.
Prerequisites: Signed in as a superuser or tenant admin. At least one statement has been executed since the manager started. Note: the history is an in-memory ring buffer (256 entries) and resets on manager restart.
Steps (UI):
- Navigate to a tenant detail page (click Tenants, then select the tenant).
- The page shows a Recent statements panel below the pool list. Statements appear newest-first with the SQL text, the node that handled it, the duration, and the status.
- The same panel appears on the pool detail page, scoped to statements routed to that pool.
CLI equivalent:
# Recent statement history (newest first)
qod node statements --limit 20
Verify: Run a known query through the FlightSQL edge. Refresh the Recent statements panel. The query appears at the top of the list.
Related: Observability.
Common failure modes
| Symptom | Likely cause | Where to look |
|---|---|---|
/api/* returns 401 | QOD_API_KEY is set but the request header is missing or wrong | Pass X-API-Key: <key> (or QOD_API_KEY) or run qod login; check env var on manager startup |
no node with role READONLY or DUAL | All nodes flipped unhealthy (port unreachable) | Run pgrep -fl spawn-quack-node; if 0 processes, run qod pool stop then qod pool scale to respawn |
access denied: missing RO grant on ... | ACL is enabled and the user has no matching role-permission grant | Add the grant via qod role permission grant or the Users screen; or set QOD_ACL_ENABLED=false for dev |
session expired; please reconnect | Bearer token is not recognized (manager restarted, clearing the in-process denylist and session store) | Run qod login again or pass Basic credentials; the static QOD_API_KEY continues to work after a restart |
Could not connect to server for http://127.0.0.1:21NNN/quack | Quack child process died after the manager restarted (local mode does not adopt survivors) | Wait for the next reconcile tick (default 30 s) to respawn; or run qod pool stop then qod pool scale immediately |
Manager hangs at startup after BaseAllocator log line, JVM pegged at 100% CPU | INSTALL quack is blocked by a corporate proxy; DuckDB silently retries fetching the extension | Pass HTTP_PROXY / HTTPS_PROXY / NO_PROXY to the manager process; see the README "Behind a corporate proxy" section |
For the full failure and recovery matrix (Postgres outage, TLS expiry, disk full, multi-manager race) see Resilience and recovery.
Related: Resilience and recovery, Authentication.